Information Center
Pivot Report - Step by Step
In this tutorial we will look at creating a pivot or summary report. We will create a report that allows to count the people based on different grouping criteria (the country of the institute they are affiliated with, the department or the gender). You will learn how to create a report that offers the possibility to group data using the standard HRT/CET pivot control.
Step 1. Create a new Report
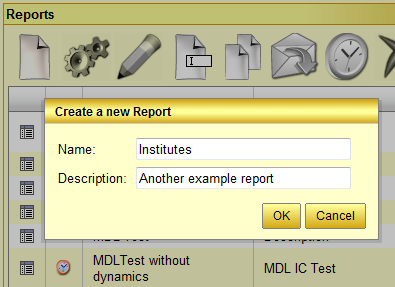
The first step is to create a new report. Proceed as you were shown in the first tutorial on the main documentation page. Let's call this report "Institutes":
When the new report has been created, open it in edit mode by selecting it in the list of reports and clicking the pencil icon of the toolbar.
Step 2. Select the Tables we need
For this report we need the Persons table. Please remember that there are two versions of this table. One that contains only persons currently considered to be at CERN or at least having some recent contact with CERN (Persons (Current)), and one that contains everyone ever registered at CERN (Persons (Full)). Lets choose the latter one for this report.
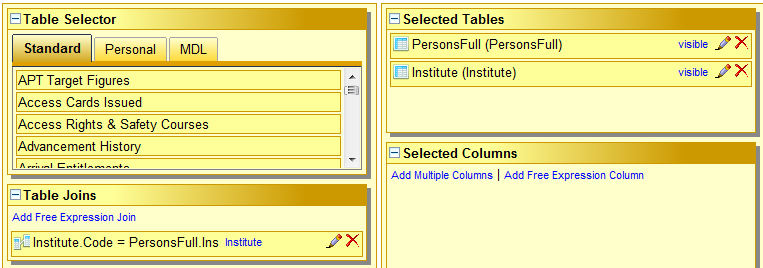
We also need the Institutes table. To select them drag them from the "Table Selector" to the list of selected tables next to it. When selecting the second table, a join will be automatically created. A join is a relationship between two (or more) added tables. It indicates how the lines coming from one table are put in relation with the lines of the other table. In our case, the link will be mode using the institute code.
For the most common cases, joins are created automatically. Nevertheless, there may be occasions in which you have to create the joins yourself. You can also change a join at any time (regardless of whether it was created automatically or manually).
At the end of this step, your list of selected tables and joins should look similar to the above screenshot. Next to the join, you find a small blue link labelled "Institute". This link indicates which table is the table "driving" the join. To change it to the other table, just click the link. At the end, when the report is finished there must be at least one table that is not linked to any join.
Step 3. Select the data
We now need to select the data we wish to show or summarise (group) by.
Remember that in a pivot report we are really generating statistics so we would like to have several groupings, like people per country, people per gender etc. and one or more criteria to count by (for instance the number of people).
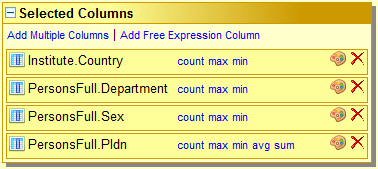
Let's start by using the Column Selector to select the ones we would like to be able to group by. For this tutorial we have chosen the following columns:
- Institute.Country
- PersonsFull.Department
- PersonsFull.Sex
This gives us three grouping options that can later be combined. To select the columns, you can e.g. use the quick column selector that appears when clicking the button "Add Multiple Columns" in the list of selected columns.
We also need to have some kind of numeric value to display. What we would like to do is to count the number of people. A single person is identified by his Person Id at CERN. So lets choose that. The column can be selected either by dragging it from the column selector or by using the quick column selector again:
- PersonsFull.PIdn.
When all the before mentioned columns are selected, your list of selected columns will look similar to the following screenshot:
We now have one more task to perform on the selected columns. We did say that we wanted to have the number of people as the value to present. This implies counting the people. We need to tell Information Center to do that.
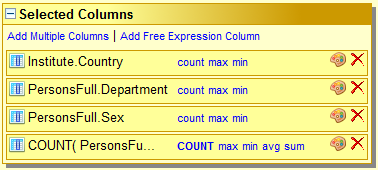
As you can see there are a number of Aggregations to the right of the column name in the list of selected columns. Clicking on the word COUNT will highlight this word and you can also see the Select Column Change slightly. This means that we have now asked Information Center to perform a count of the number of Person Id's (people) that the query will return.
Your list of selected columns should now look like this:
Step 4. The conditions
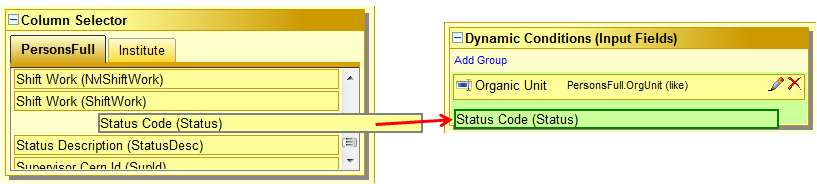
In order to limit the amount of data returned, we specify two dynamic conditions. Dynamic conditions will result in search fields that are generated in the report form once it is executed. Let's create two search fields, one for the organic unit and another one for the person status. For both of them, just drag the corresponding columns from the column selector on the left hand side to the list of dynamic conditions on the right hand side:
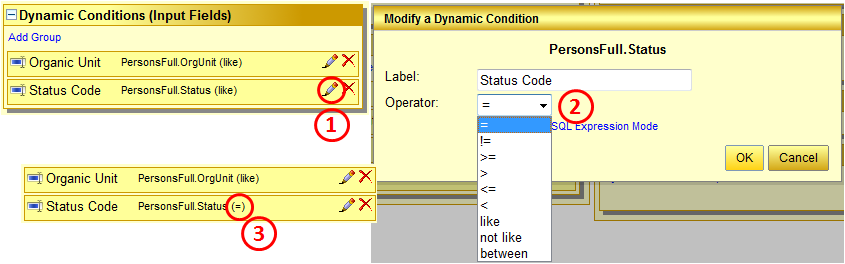
Once the conditions are added, they appear both in the list (see figure 1 in the below screenshot). At first, both conditions are created using a LIKE operator. Such an operator allows to check for partial matches in the specified column. For the person status we do not need partial matching and would like to use the better performing equality operator. To change the operator, click on the small pencil icon next to the "Status Code" dynamic condition (see 1 below).
A small dialog will be opened. Within the dialog you can change the label which appears in front of the generated search field and the used operator. Choose the "equality" operator (2) and close the dialog with "Ok". The editor will now reload and the chosen operator will be displayed next to the column name (3).
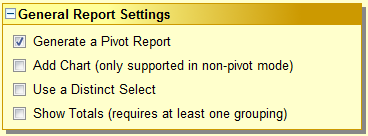
Step 5. Make it a pivot report
Now, it is time to make the report a pivot report. To do so, tick the checkbox "Generate a Pivot Report" in the general report settings area on the bottom side of the left most editor column:
Step 5. The Groupings
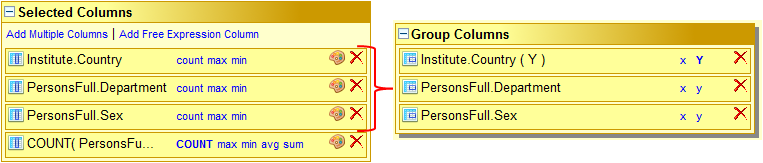
To make the report run-able, all the columns not having an aggregation must be selected as grouping columns:
In order to select grouping columns, just drag the first three select columns (all the columns not having an aggregation) over to the list of group columns. Next to each selected group column, two layout options (X and Y) appear. These layout options indicate which group columns should be selected by default (when the report is run without opening the "Grouping Layout" selector) and on whether they should be used as row (Y) or column groupings (X). In order to make the report executable, at least one group column must be marked as having a "Y" layout. To select a layout, just click the blue "x" or "y" letters.
When finished, the list of group columns should look like on the right hand side of the above screenshot.
Step 7. Run it
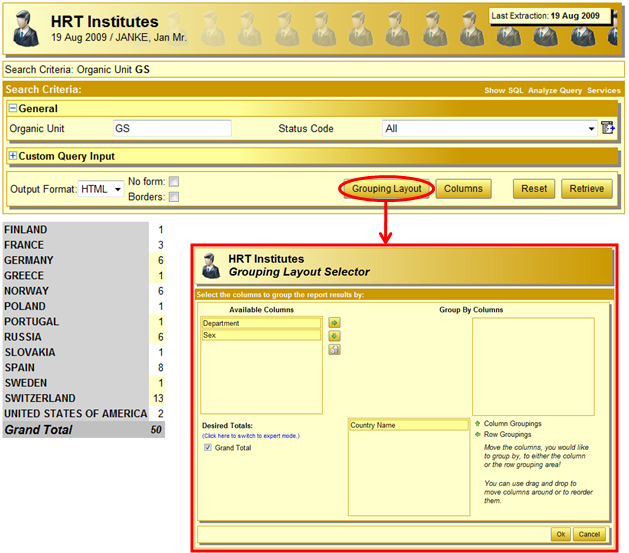
You're report is now ready to be executed. Just click on the run icon at the top of the report editor (the icon with the two wheels on it). Your report is now ready for execution. By default, the only group column which is used is the country as it is the only one marked with a layout in the report editor.
In order to change the grouping columns, just click the button "Grouping Layout". There by default, you only see "Country" in the row groupings area. The two other columns are nevertheless available and can be dragged to row or column groupings and will be used for grouping once the report is re-executed.
Of course there are many more enhancements that can be done to this report. The report will, for instance, count anyone that has ever been at CERN and is attached to a institute, it will count people attached to inactive institutes, etc. This can be changed by adding additional static or dynamic conditions. Discovery of these is left as an exercise to the reader since you have reached the end of this tutorial.